Life is not linear
Some things in life are easy to predict. If it takes 20 seconds to fold a napkin, you fold ten napkins in 200 seconds. If you can buy one bun for 1.5$, you can buy two for 3$. These simple conclusions are based on the fact that the napkin folding time and the total bun cost increase at a steady pace. We say that they increase linearly.


Linear models are useful in many contexts. Your electricity bill grows linearly with the number of kilowatt hours you consume, the price of your electric scooter ride depends linearly on how many minutes you travel, and the number of beers you need to buy for dinner, depends linearly on how many people are expected to come. But there are situations in everyday life where our tendency to think linearly can lead us astray.
Surprising surge
In a lake, there is a patch of lily pads. Every day, the patch doubles in size. If it takes 48 days for the patch to cover the entire lake, how long would it take for the patch to cover half of the lake?
The question above is taken from the book Think, fast and slow by Nobel laureate Daniel Kahneman. What is your answer?
The answer is almost obvious: 24 days. Or is it? If you read carefully, the questions states that the accumulation of lily pads gets twice as large every day. Since the entire lake is covered with lily pads after 48 days, half of the lake must be covered the previous day, ie. after 47 days.

If you are one of those who intuitively answered 24 days, you have let yourself be misled by your linear thinking. You are not alone! We are so used to thinking linearly, that we instinctively assume that the area of lily pads increases by a number of square meters every day. In fact, the increase is not additive, but multiplicative. For each passing day, the area is multiplied by a factor, in this case factor 2. Such a multiplicative increase has a special name, exponential growth, and it corresponds to a graph that bends towards infinity.

In everyday language, the concept of exponential growth has become synonymous with something increasing very quickly. Author Kit Yates has successfully illustrated the increase in his playful poem Exponential Growth.

The king and the chessboard
That exponential growth can imply a surprising rate of increase, became exorbitant for the king in a popular legend. According to legend, the king wanted to reward the inventor of the chessboard. The inventor suggested that the reward be paid in rice grains: 1 rice grain should be placed on the first square of the chessboard, 2 rice grains on the second square of the chessboard, 4 rice grains on the third square, and then a doubling of the number of rice grains for each new square on the chessboard. The king smiled at the inventor's modest claim and ordered his treasurer to pay the reward. But a week later, the inventor returned. He had not received his reward. The reason, the king was told, was that the inventor's reward corresponded to more rice than was available in the kingdom. In fact, just the number of rice grains on the 64th square (2^63 pieces) was more than the number of grains of sand on the earth!
The king of this story is not alone in having difficulty understanding exponential relationships. The physicist Albert Bartlett has said that: "The greatest shortcoming of the human race is our inability to understand exponential growth." This may be an exaggeration, but our inability to comprehend exponential relationships may well have serious consequences. One such example is the spread of infection. When a contagious disease spreads, the number of new cases initially increases exponentially. If we start from patient zero and assume that the number of new disease cases doubles every day, then on the ninth day we will register 64 new disease cases. It may not sound very alarming, but already a week later the model predicts that we will register 32,768 (!) new cases in one day. Although our exponential model is unreasonable in the long run, it illustrates that linear thinking can cause us to seriously misjudge the risks of contagion.
Thinking, fast and slow
Nobel laureate Daniel Kahneman's research has shown that we humans like to avoid thinking hard. When we are faced with a question, we place great faith in the first answer that emerges. Because linear thinking is fast and intuitive, we therefore apply it in both possible and impossible contexts. The phenomenon is called linear bias. By becoming acquainted with a few more non-linear relationships, you can avoid the most common logical fallacies.
If you want, you can start by putting your non-linear thinking to the test here! Scroll down to Test your nonlinear aptitude.
The power of the square
Let’s say that you have sewn a square cloth with side length 1 m. How much fabric is needed to make a similar cloth with a side length of 3 meters? Many people's instinctive answer is that it takes three times as much fabric, but then they think linearly. In fact, the amount of fabric is increased ninefold. This becomes clear if you draw a picture.
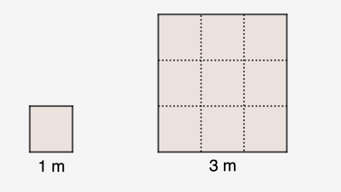
The fact that the relationship between fabric area and side length is not linear, is due to the fact that the area of the fabric depends on the side length squared. If you draw a graph of the relationship, you see that the graph is a curve, rather than a straight line. The fabric area thus increases faster and faster the longer the side length of the cloth.

Having a sense of quadratic relationships can actually save lives in traffic. In a linear world, an increase in speed of 50% would lead to a 50% increase in braking distance. But the braking distance depends on the speed squared. A 50% increase in speed therefore results in the braking distance more than doubling – it increases by as much as 125%.

The deceiving denominator
The relationship between speed and braking distance is not the only non-linear relationship in traffic that can be confusing. Let's say you drive between the two biggest cities in Sweden, Stockholm and Gothenburg, at an average speed of 90 km/h. If you increase the speed to 110 km/h, you save a total of 56 minutes in travel time. Most car drivers expect the same time saving if they increase the speed from 110 km/h to 130 km/h, since the increase is again 20 km/h. But the time saving in this case is surprisingly only 39 minutes. The thought trap is that we assume that the relationship between time and speed is linear. In fact, time is inversely proportional to velocity, t = d/v, which results in a graph like this.


The effect of inversely proportional relationships can be costly also in a business context. Say you are considering lowering the price of an item by 20%. How many more items do you have to sell for the revenue to be the same? Our linear thinking gives us a quick answer: 20%. But mathematics tells us otherwise. You need to increase the number of items sold by 25% in order for the revenue to remain unchanged – and even more so if you expect the price reduction to give you a profit.

If the price is lowered by 20 % (factor 0,8), then the quantity needs to be increased by 25 % (factor 1,25) to keep the revenue (price x quantity) unchanged.
Tipping points
Linear thinking also sets us up for surprises when we have to assess our effects on climate. It is easy to think linearly and assume that a halving of emissions leads to a halving of global warming, or that a reduction in aviation emissions by 60% leads to a reduction in aviation's climate impact by 60%. As we have seen from the examples above, many relationships are more complicated than that.
The same linear intuition tells us that a small change in the climate should have little impact on the environment. But when our natural ecosystems reach a turning point, even a small change in conditions can give rise to sudden changes in nature. This phenomenon is called tipping points.

Understanding tipping points is crucial to be able to predict the effects of climate change on the planet.
Challenge your linear thinking
Our brain takes shortcuts. If we do not require it to consciously reflect, it will suggest the simplest answer for us, and the simplest answer is often based on linear thinking. As we have seen, there are many situations in our world that cannot be modeled with linear relationships. Instead, they are described by graphs that bend toward infinity, curl toward the x-axis, or exhibit sharp turns. To orient oneself in this world, one therefore needs to be aware of the potential power of the square, the explosiveness of exponential growth and the possible presence of tipping points. Because life, dear reader, is not linear.
Referenser och vidare läsning
Kahneman, Daniel (2011) Thinking, fast and slow, Doubleday
Goodrum, Will (2018) Simple, Attractive, and Wrong: An Introduction to Linearity Bias
de Langhe, Bart et. al. (2017) Linear Thinking in a Nonlinear World, Harvard Business Review
Ocean tipping points, http://oceantippingpoints.org/project-overview